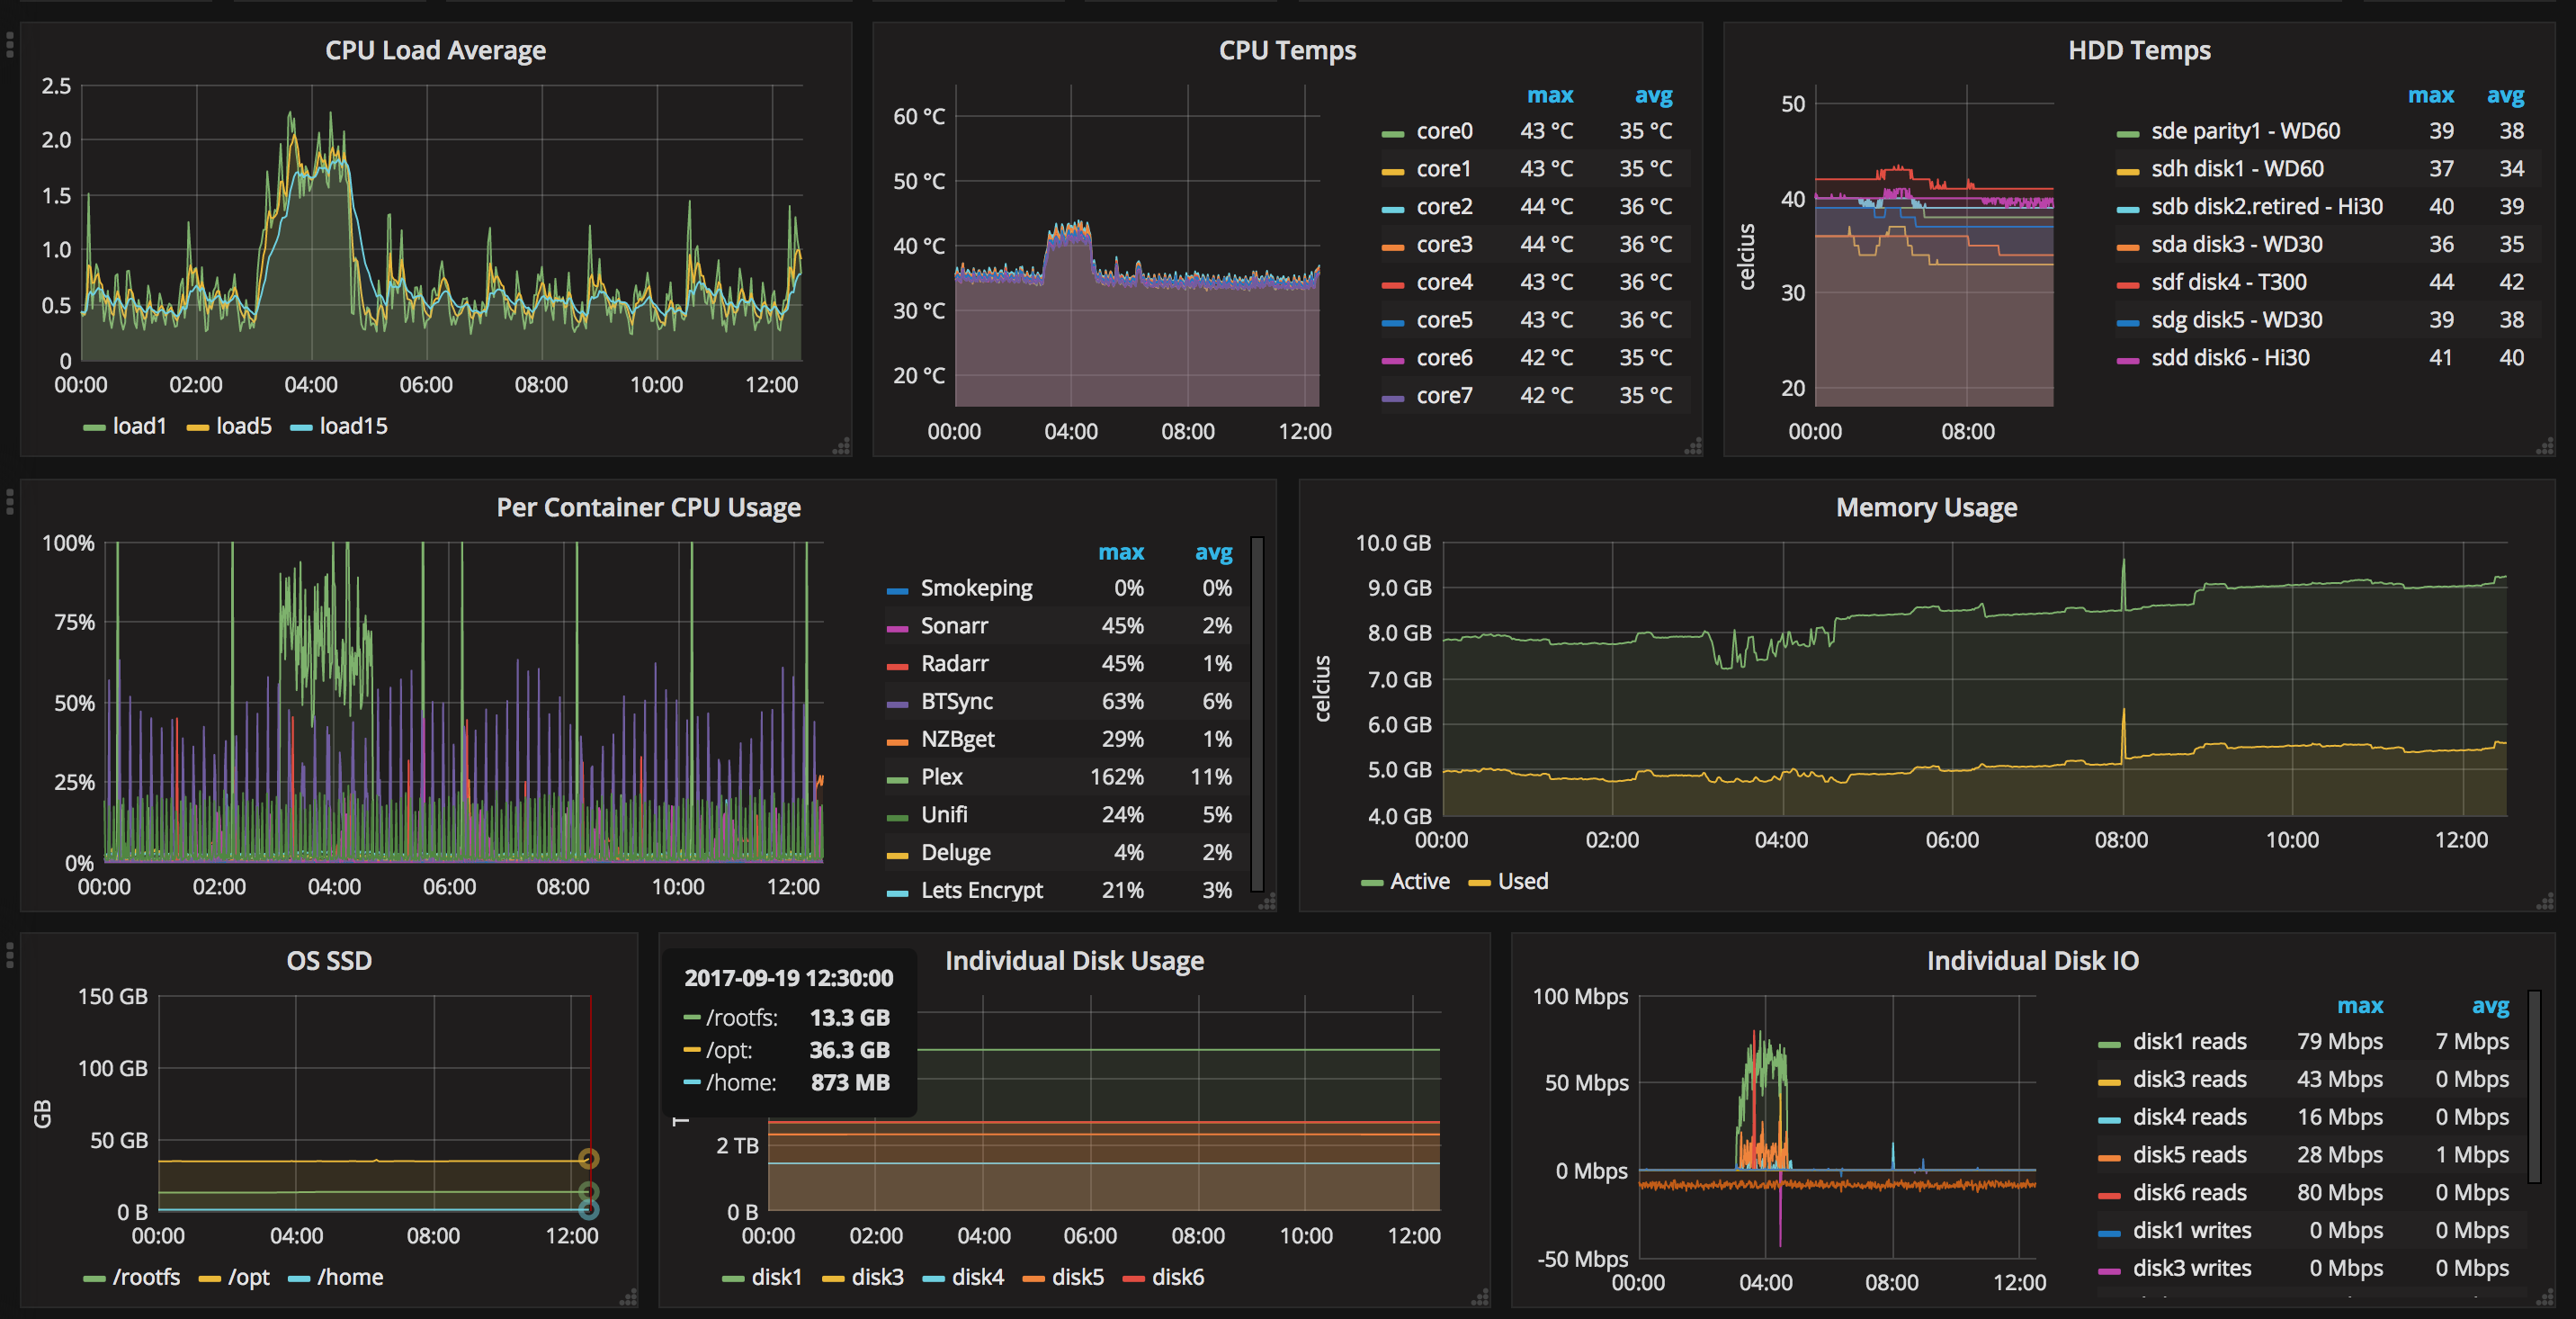
OpenWRT+Grafana+InfluxDB

Overview/
├── System Environment Setup/
│   ├── Debian 10 VM Configuration
│   │   ├── InfluxDB Installation
│   │   └── Grafana Installation
│   └── OpenWRT Network Device Configuration
├── Installation and Configuration of InfluxDB on the VM/
│   ├── Package Installation and Dependencies
│   │   ├── Install InfluxDB and Dependencies
│   │   ├── Configuration of InfluxDB
│   │   └── Setting Up Database and Retention Policy
│   └── Starting InfluxDB Service
├── Grafana Installation and Setup on the VM/
│   ├── Grafana Package Installation
│   │   ├── Install Grafana
│   │   ├── Configuring Grafana for Port 80
│   │   └── Setting Grafana to Run as Non-Root
│   └── Enabling Grafana Service on Startup
├── Installing and Configuring Collectd on OpenWRT/
│   ├── Collectd Package Installation
│   │   ├── Install Collectd and Modules
│   │   └── Configuring Collectd Service
│   └── Starting Collectd Service
├── Verifying the Configuration/
│   ├── Checking OpenWRT Configuration
│   └── Verifying Data Update in InfluxDB
└── Setting Up the Grafana Dashboard/
    ├── Creating a New Data Source
    └── Importing an Existing Dashboard
        └── Note on Dashboard Functionality
1. System Environment Setup
- Debian 10 Virtual Machine (VM) equipped with InfluxDB (v1.7.10 or higher) and Grafana (v6.7.2 or higher)
- Network device operating with OpenWRT (version 18.06 or above)
2. Configuration of InfluxDB
Proceed with the installation of necessary packages and dependencies:
sudo wget -qO- https://repos.influxdata.com/influxdb.key | sudo apt-key add -
echo "deb https://repos.influxdata.com/debian buster stable" | sudo tee /etc/apt/sources.list.d/influxdb.list
sudo apt update
sudo apt install -y influxdb
Important Note: If you encounter an error such as: E: gnupg, gnupg2, and gnupg1 are not installed, but one of them is required for this operation, you should install the ‘gpg’ package:
sudo apt install gpg
Post-installation of InfluxDB, configure the /etc/influxdb/influxdb.conf file to activate the Collectd plugin (find and uncomment the lines below):
[[collectd]]
   enabled = true
   bind-address = ":25826"
   database = "${YOUR_DB_NAME}"
   retention-policy = ""
   typesdb = "/usr/local/share/collectd/types.db"
   security-level = "none"
   batch-size = 5000
   batch-pending = 10
   batch-timeout = "10s"
   read-buffer = 0
Creation of the ‘types.db’ file:
sudo mkdir -p /usr/local/share/collectd/
sudo wget -O /usr/local/share/collectd/types.db https://raw.githubusercontent.com/CactusProjects/openwrt_influxdb/master/types.db
Initiate and enable the InfluxDB service to start on boot:
sudo systemctl enable --now influxdb
Generating a new Influx database:
influx
CREATE DATABASE ${YOUR_DB_NAME}
exit
Setting a one-month retention policy for your database:
DROP RETENTION POLICY "autogen" ON "${YOUR_DB_NAME}"
CREATE RETENTION POLICY "one_month" ON "${YOUR_DB_NAME}" DURATION 730h0m REPLICATION 1 DEFAULT
3. Grafana Installation and Setup
Install the required package
sudo add-apt-repository "deb https://packages.grafana.com/oss/deb stable main"
sudo apt update
sudo apt install grafana
Note: In case you face an error like: bash: add-apt-repository: command not found, it indicates the need to install the ‘software-properties-common’ package:
apt install software-properties-common
To operate Grafana on port 80, modify the /etc/grafana/grafana.ini file:
http_port = 80
Subsequently, execute the following command to permit Grafana to run as a non-root user (default user is ‘grafana’):
sudo setcap 'cap_net_bind_service=+ep' /usr/sbin/grafana-server
Enable and start the Grafana service to run on system startup:
sudo systemctl enable --now grafana-server.service
4. Configuring Collectd on OpenWRT
Install the necessary packages
sudo opkg install collectd collectd-mod-cpu collectd-mod-dns collectd-mod-interface collectd-mod-iwinfo collectd-mod-load collectd-mod-logfile collectd-mod-memory collectd-mod-network collectd-mod-openvpn collectd-mod-ping collectd-mod-rrdtool collectd-mod-thermal collectd-mod-uptime collectd-mod-wireless
Configure the /etc/collectd/collectd.conf file for the Collectd service:
BaseDir "/var/run/collectd"
Include "/etc/collectd/conf.d"
PIDFile "/var/run/collectd.pid"
PluginDir "/usr/lib/collectd"
TypesDB "/usr/share/collectd/types.db"
Interval 10
ReadThreads 2
Hostname "${YOUR_OPENWRT_HOSTNAME_HERE}"

LoadPlugin ping
<Plugin ping>
        TTL 127
        Interval 10
        Host "1.1.1.1"
</Plugin>

LoadPlugin memory
LoadPlugin cpu
LoadPlugin load
LoadPlugin uptime

LoadPlugin interface
<Plugin interface>
        IgnoreSelected false
        Interface "YOUR_INTERFACE_1_NAME_HERE" # e.g., "pppoe-wan"
        Interface "YOUR_INTERFACE_2_NAME_HERE" # e.g., "br-lan"
        Interface "YOUR_INTERFACE_3_NAME_HERE"
</Plugin>

LoadPlugin dns
<Plugin dns>
        Interface "YOUR_INTERFACE_1_NAME_HERE" # e.g., "pppoe-wan"
        Interface "YOUR_INTERFACE_2_NAME_HERE" # e.g., "br-lan"
        Interface "YOUR_INTERFACE_3_NAME_HERE"
        IgnoreSource "127.0.0.1"
</Plugin>

LoadPlugin thermal
<Plugin thermal>
        IgnoreSelected false
</Plugin>

LoadPlugin network
<Plugin network>
        Server "${YOUR_INFLUXDB_SERVER_ADDRESS_HERE}" "25826"
        CacheFlush 86400
        Forward false
</Plugin>
Start Collectd and ensure it's enabled to run on system startup:
sudo /etc/init.d/collectd start
sudo /etc/init.d/collectd enable
5. Verifying the Configuration
To confirm that OpenWRT is correctly configured, connect to your Grafana/InfluxDB server via SSH and execute:
influx
use ${YOUR_DB_NAME}
show measurements
select * from uptime_value
Check if the records are being updated every 10 seconds.
6. Setting Up the Grafana Dashboard
Access your Grafana webUI and follow these steps:
Create a New Data Source
- Navigate to
https://${YOUR_GRAFANA_SERVER_ADDRESS}/datasourcesand click on "Add" - Alter "Name"
- Enter details in the "URL" field under HTTP settings
- Complete the "Database" field and set "HTTP method" to GET under "InfluxDB Details" settings
Import an Existing Dashboard
- Hover over the + sign on the left side of the screen
- Select Import
- In the Grafana.com Dashboard field, enter "11858"
- Click on the Load button
Important Note: Some dashboard elements, such as Wi-Fi-related features, might not function immediately after creation. It's essential to verify and adjust the queries to match your specific setup.